Patches between subplots
In some figures you may want to point in a region and relate to a position in a plot. This can be done using ConnectionPatch from matplotlib.
The patch coordinates must be inside the displayed plot
If you plot from A to B into axis[A] it may be hidden by axis[B].
from matplotlib.patches import ConnectionPatch
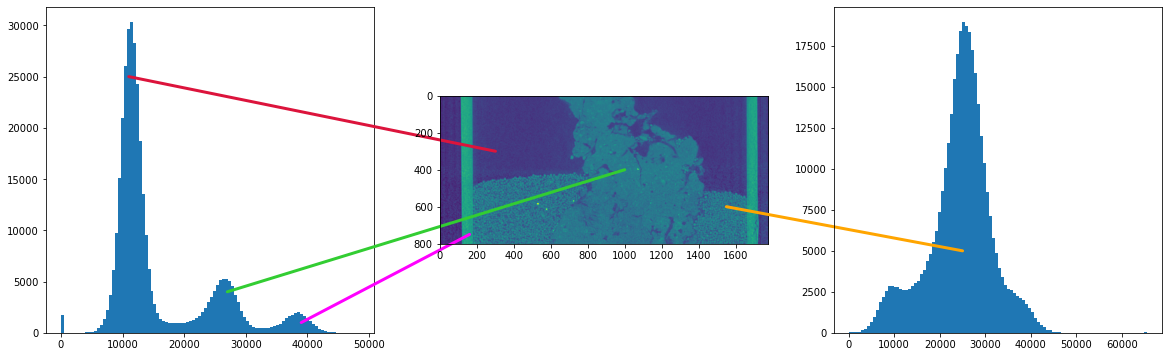
fig,ax=plt.subplots(1,3,figsize=(20,6))
# Do the plotting
ax[0].hist(vslice[0:200].ravel(),bins=100)
ax[1].imshow(vslice);
ax[2].hist(vslice[600:800].ravel(),bins=100);
# Patch to the void
con = ConnectionPatch(xyA=(11000,25000), xyB=(300,300), coordsA="data", coordsB="data",
axesA=ax[0], axesB=ax[1], color="crimson", lw=3)
ax[1].add_artist(con)
# Patch to the aggregate
con = ConnectionPatch(xyA=(27000,4000), xyB=(1000,400), coordsA="data", coordsB="data",
axesA=ax[0], axesB=ax[1], color="limegreen", lw=3)
ax[1].add_artist(con)
# Patch to the tube
con = ConnectionPatch(xyA=(39000,1000), xyB=(160,750), coordsA="data", coordsB="data",
axesA=ax[0], axesB=ax[1], color="magenta", lw=3)
ax[1].add_artist(con)
# Patch to the sand
con = ConnectionPatch(xyA=(25000,5000), xyB=(1550,600), coordsA="data", coordsB="data",
axesA=ax[2], axesB=ax[1], color="orange", lw=3)
ax[2].add_artist(con)