Adding a scale bar in the image
Scale bars are essential features of a figure in a publication. Matplotlib doesn’t have this implemented but there is an add-on module that allows you to draw scale bars in your figures called matplotlib-scalebar.
The module is only available using pip and you can install it with
pip install matplotlib-scalebar
To insert the scale bar in your figure you have to create a scalebar patch which will be inserted in the figure:
import numpy as np
import matplotlib.pyplot as plt
from matplotlib_scalebar.scalebar import ScaleBar
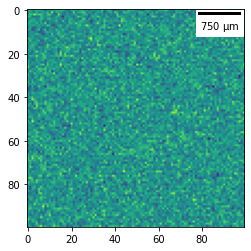
img = np.random.normal(0,1,size=(100,100))
plt.imshow(img)
pixel_size = 60/1590
scalebar = ScaleBar(pixel_size, 'mm')
plt.gca().add_artist(scalebar)
If you use plt.subplots the same effect can be achived with
fig,ax = plt.subplots(1,2)
ax[0].imshow(img)

pixel_size = 60/1590
scalebar = ScaleBar(pixel_size, 'mm')
ax[0].add_artist(scalebar)