Sub-panel labels for publication ready figures
In publications, it is good style to label subfigures with (a), (b), etc. to easier refer to them in text and figure caption. These labels can of course be added in the text editor of you choice, but here I’ll show you how to add these label directly in the figure creation.
import numpy as np
import matplotlib.pyplot as plt

img = np.random.normal(0,1,size=(100,100)) # create some test data

# font size and labelposition may have to be adjusted depending on the figure dimensions
fontsize=16
labelposition= -0.12

fig, ax = plt.subplots(1,2,figsize=(11,4))

# Show the figure, panel 1
a0=ax[0].imshow(img, cmap='gray')
fig.colorbar(a0,ax=ax[0], shrink=0.8)
ax[0].set_xticks(ticks=[])
ax[0].set_yticks(ticks=[])

# Set label for panel 1 -> (a)
ax[0].text(0.5, labelposition, '(a)', transform=ax[0].transAxes, fontsize=fontsize, ha='center',va='center')

# Show the histogram, panel 2
ax[1].hist(img.ravel(),bins=100,label='Normal distributed data')
ax[1].legend()

# Set label for panel 2 -> (b)
ax[1].text(0.5, labelposition, '(b)', transform=ax[1].transAxes, fontsize=fontsize, ha='center',va='center') ;
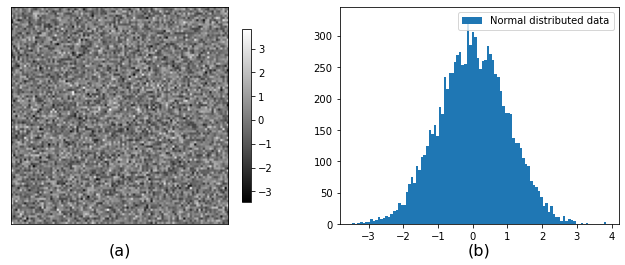
Note you may have to adjust the figure size to get the same hight of the two panels.