Adding error bands to a scatter plot
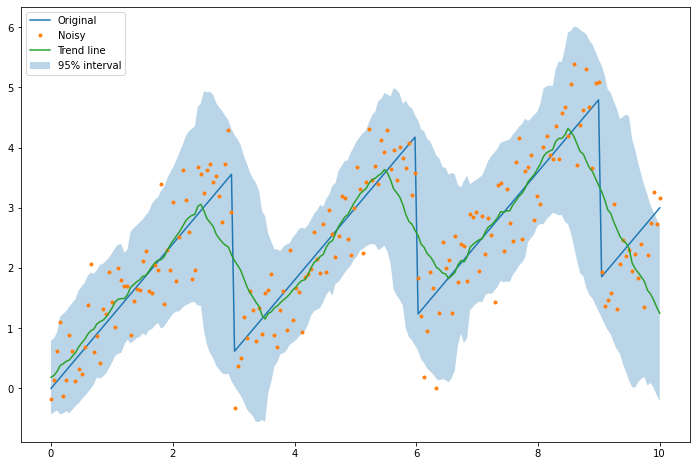
Error bands is often easier to interpret than a cluttered scatter plot. Here is an example how to create the error bands using numpy.convolve() for the moving average and standard devivation which are needed to display the bands. The error bands are plotted using matplotlib.pyplot.fillbetween().
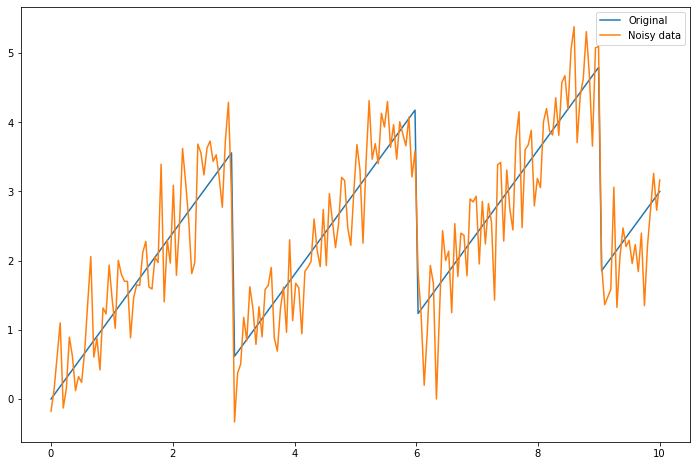
In the example we start with a plot looking like this.
And end with this result.
![]()
![]()